 |
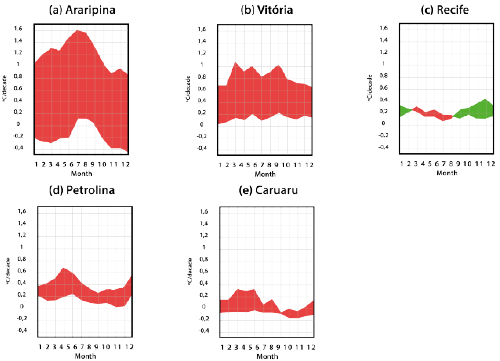
| Figure 2: Decadal trend of maximum temperatures (solid line) and minimum (dashed line) (°C/decade) for each month of the year for the (a) Araripina, (b) Vitória de Santo Antão (c) Recife, (d) Petrolina, and (e) Caruaru stations. The red (green) cross-hatch indicates that the decadal rate of change in the maximum temperature is higher (lower) than that of the minimum temperature from 1950-1965 to 2010. |