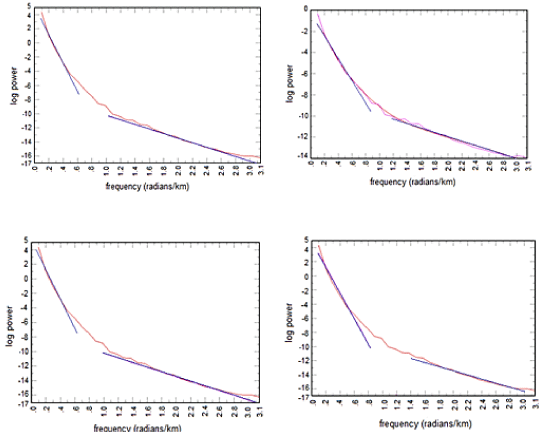
Figure 8d:
Power spectrum plots of aeromagnetic data of parts of the study area (Blocks M-P).