 |
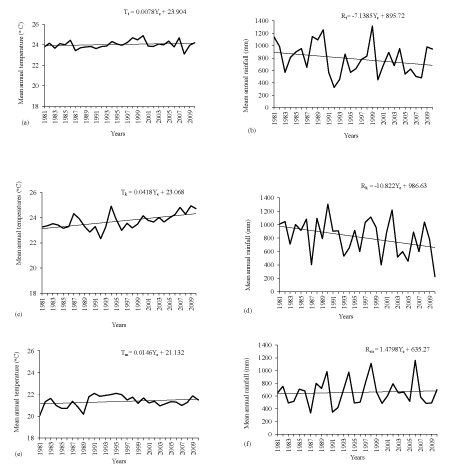
| Figure 2: Annual variability and trend (line) of the development of annual mean temperature (left hand graphs) and rainfall (right hand graphs) during the past 30 years in three study areas; (a) and (b) along Taita Hills; (c) and (d) along Mount Kilimanjaro; and (e) and (f) along Machakos Hills. |