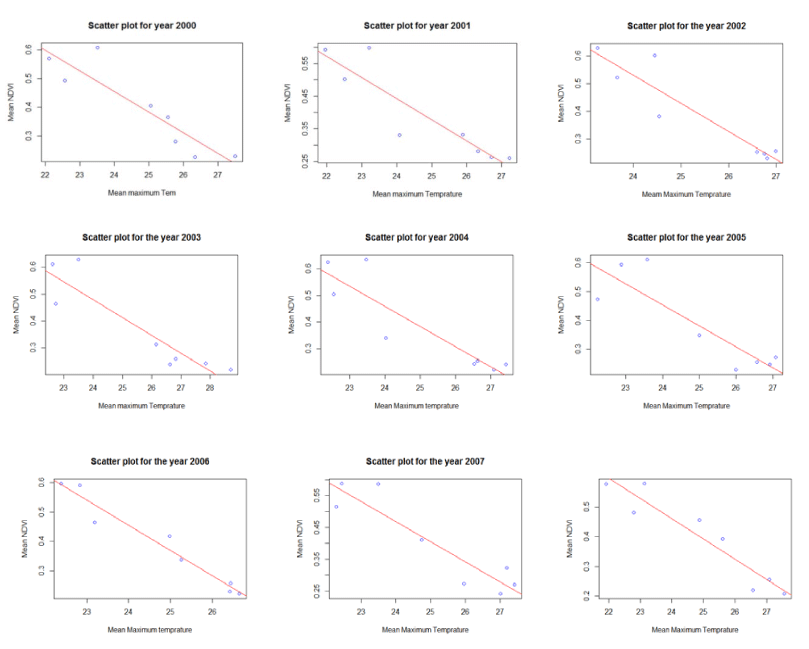
Figure 16:
Correlation between mean monthly NDVI and mean maximum monthly temperature.