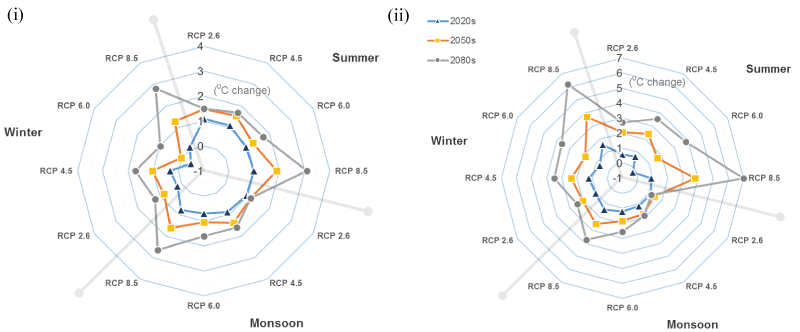
Figure 7:
Radar plot of expected change in average seasonal temperature with respect to the baseline (i) maximum temperature, and (ii) minimum temperature.