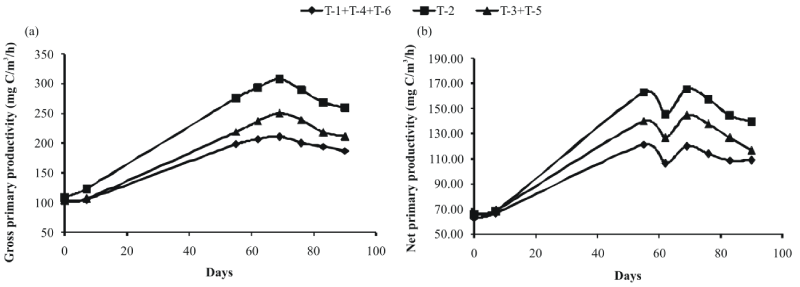
Figure 5:
Trend curves of average data for three distinctly different groups of treatments: T-2, (T-3 + T-5) and (T-1 + T- 4 +T-6). The groups were significantly different from each other, whereas the treatments within the group were not.