 |
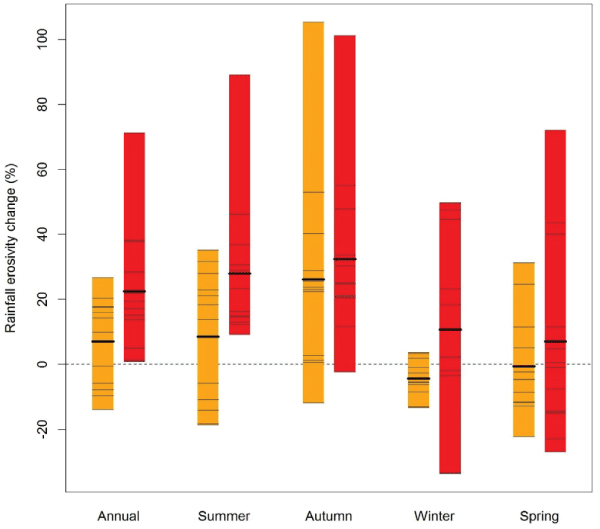
| Figure 8: Bar graph representation of future seasonal and annual changes (%) in rainfall erosivity, the yellow bars represent near future scenarios (2020-2039), while the red bars represent far future scenarios (2060-2079). Noe that the thin grey lines are the individual ensembles, the thick line is the average of all 12 ensembles, and the length of the bar shows the spread of the 12 ensemble values for NSW. |