 |
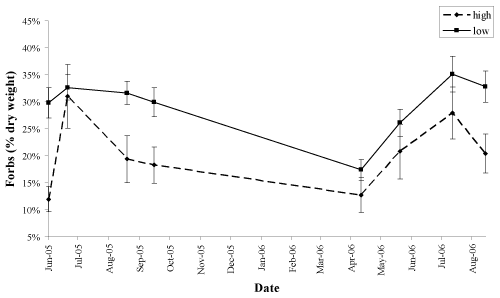
| Figure 6: Average (±SE) proportion of forbs from 25×25 cm2 subplots collected in highly and lightly grazed areas from June 2005 to September 2006 in Sheep River Provincial Park, Alberta. Cattle grazing was applied from 15 of June to 15 of October in 2005 and 2006. Intensity of grazing was estimated visually during weekly censuses. Summer, fall, and no grazing applications were pooled when no significant effect of grazing application was found. |