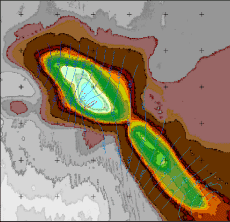
Figure 6:
Calibrated steady state groundwater flow and the scatter plot of the steady state simulation of the upper aquifer.