 |
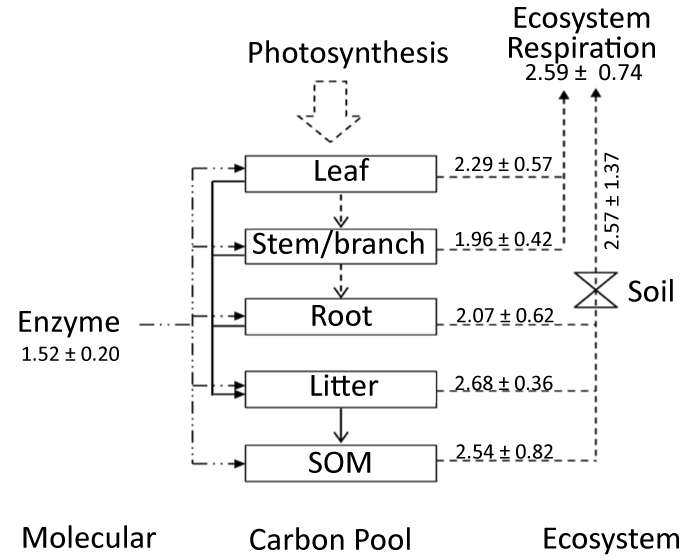
| Figure 1: Major carbon (C) pools (boxes) and fluxes (dashed arrows) at the ecosystem level, including leaf, stem/branch, root, litter, and soil organic matter (SOM). Enzyme affects all processes with dash-dot-dot line with arrows. Gaseous fluxes are indicated by broken lines. The number represents Q10 values (Mean ± SD) for respiratory C release of different components (enzyme, leaf, stem, root, microbial (SOM), soil, ecosystem respiration, and litter decomposition). The data are from Lenton et al. (2003) [5] for leaf, stem/ branch, root, SOM, and soil respiration. Litter decomposition, and ecosystem respiration are from Reichstein et al. (2002) [7], Fierer et al. (2005) [8], Larsen et al. (2007) [9], Hirota et al. (2009) [10], and Lin et al. (2011) [11]. Q10 of enzyme activity is from Parham & Deng (2000) [12] and Trasar-Cepeda (2007) [13]. |