|
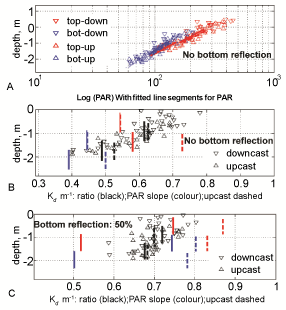
| Figure 4: A) Log (x) transformed PAR values produced following the Beer- Lambert Law for each optical depth during the down (∇) and upcast (Δ) through the water column. B) Estimates of Kd obtained from regression (vertical coloured lines: Red: top sensor and blue: bottom sensor) and from instant measurements (single values - black points and the black vertical line corresponds to the mean value). C) Estimates of Kd, considering a sea-bed reflection of 50%, obtained from regression (vertical coloured lines) and from instant measurements (single values-black points and the black vertical lines correspond to the mean value). Sensors: Top and bottom. Casts: down (solid line) and up (dashed line). |