|
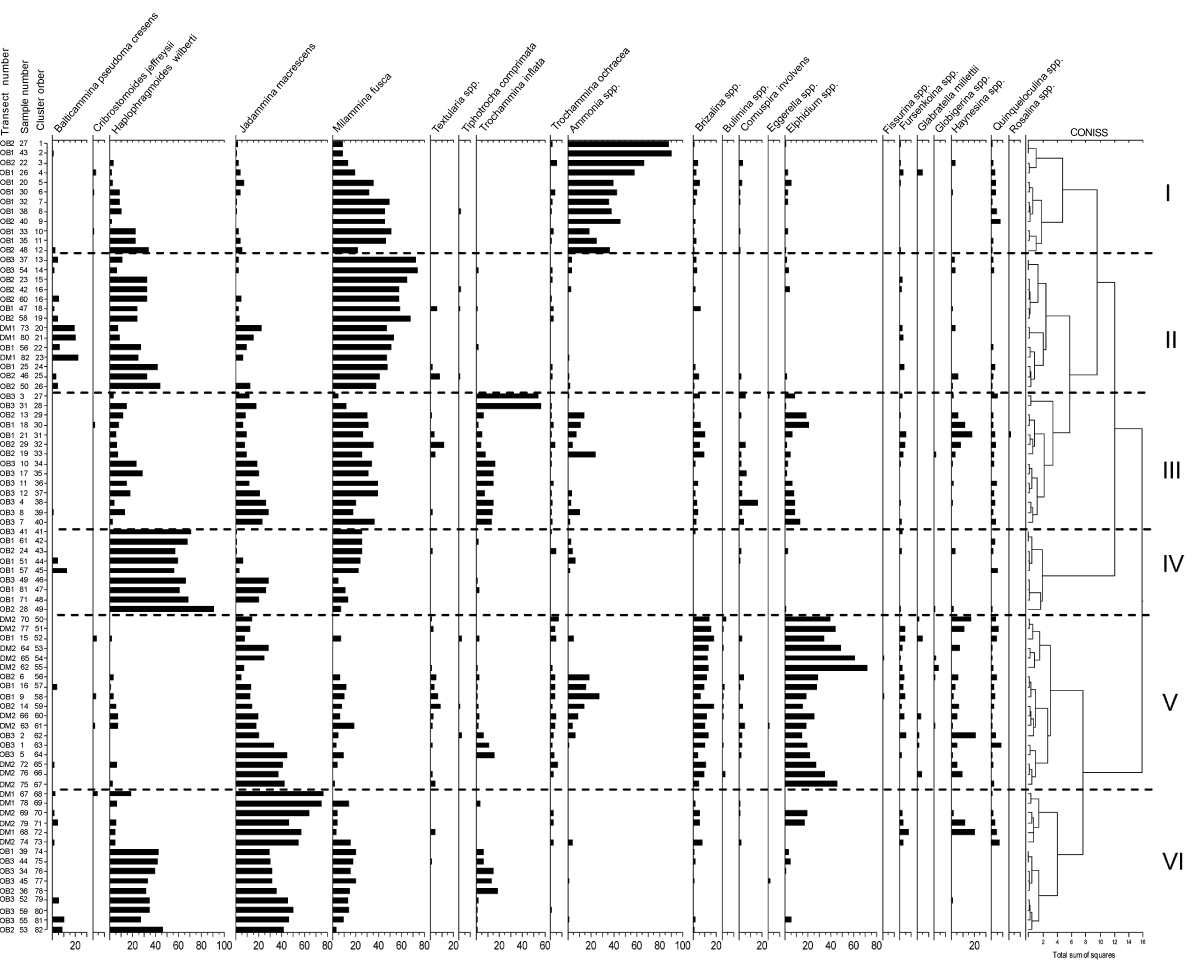
| Figure 9: Relative percentages of dead foraminifera abundance for combined Oglet Bay and Decoy Marsh, ordered by unconstrained cluster analysis based upon untransformed unweighted Euclidean distance. The cluster order is shown along with the transect which the sample was taken. OB1=OBSS1, OB2=OBSS2, OB3=OBSS3, DM1=DMSS1, DM2-DMSS2. |