 |
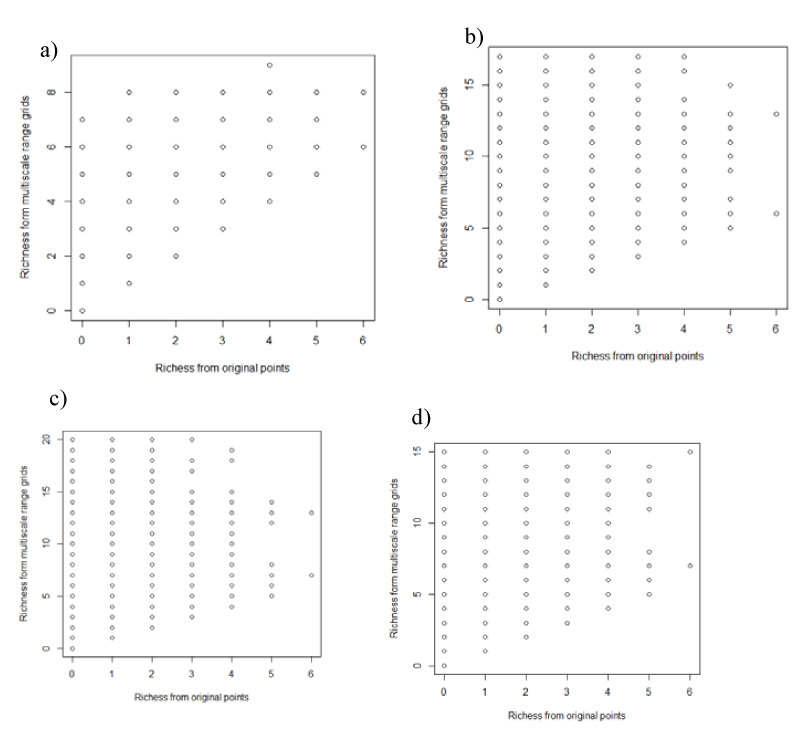
| Figure 2: The relationship of richness hotspots across the whole area from original distributional points and multi-resolution range cells: a) correlation coefficient r=0.563, P=0. Mean of resolution parameter λ =100; b) correlation coefficient r=0.18, P=0,λ =80; c) correlation coefficient r=0.16, P=0,λ =60; d) correlation coefficient r=0.27, P=0,λ =40. |