 |
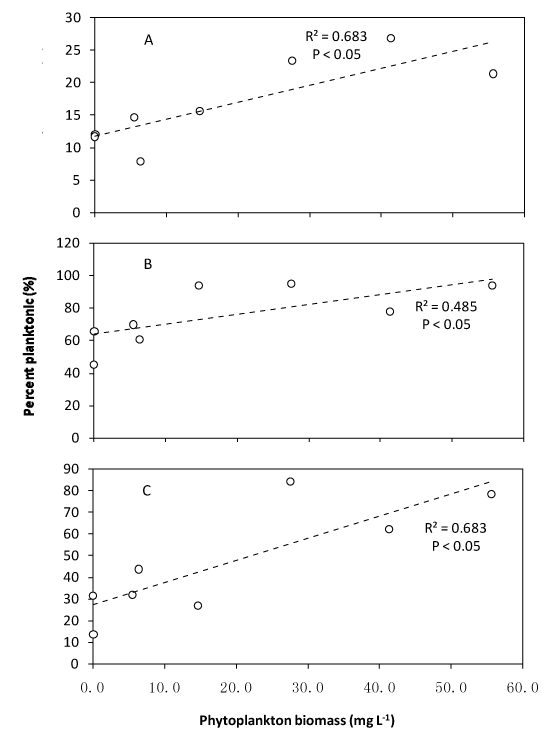
| Figure 4: Relationships between the percentages of plantonic energy subsidy to zoobenthos, including B. sowerbyi (A), L. hoffmeisteri (B) and T. chinensis (C), and the phytoplankton production. Each point represents the value for an individual mesocosm. Best fit lines, r2, and P values are given for each relationship, using linear regression. |