 |
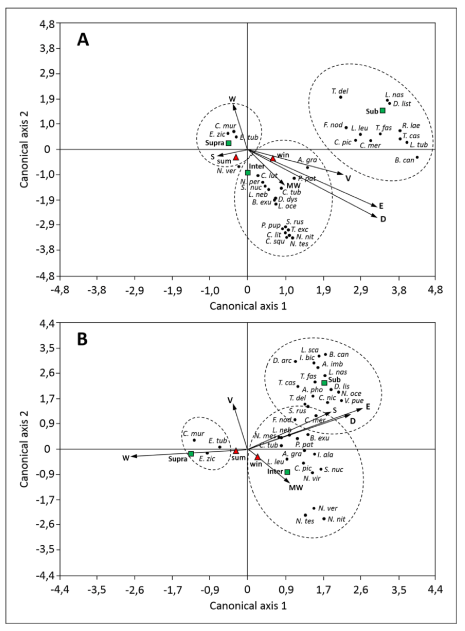
| Figure 3: Scatter plot of the canonical correspondence analysis carried out at Tibaracon (A) and Hurrutinier (B) (vectors represent ecological variables measured: W: wrinkled substratum, MW: medium wrinkled substratum, S: smooth substratum, V=vegetation cover, E: evenness, D: diversity; squares represent each stratum: Supralittoral, Interlittoral and Sublittoral); triangles represent seasons: winter and summer; black circles represent species; and elipses indicate species/stratum representations). |