 |
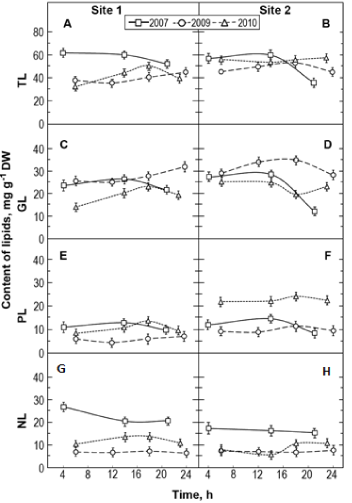
| Figure 2: Daily changes in lipid contents in the leaves of Plantago media plants in open (A, C, E, G) and shaded (B, D, F, H) sites. TL: Total Lipids; GL: Glycolipids; PL: Phospholipids; NL: Non-polar Lipids. Means ± SE from triplicate experiments, *significant difference at p≤ 0.05. |