|
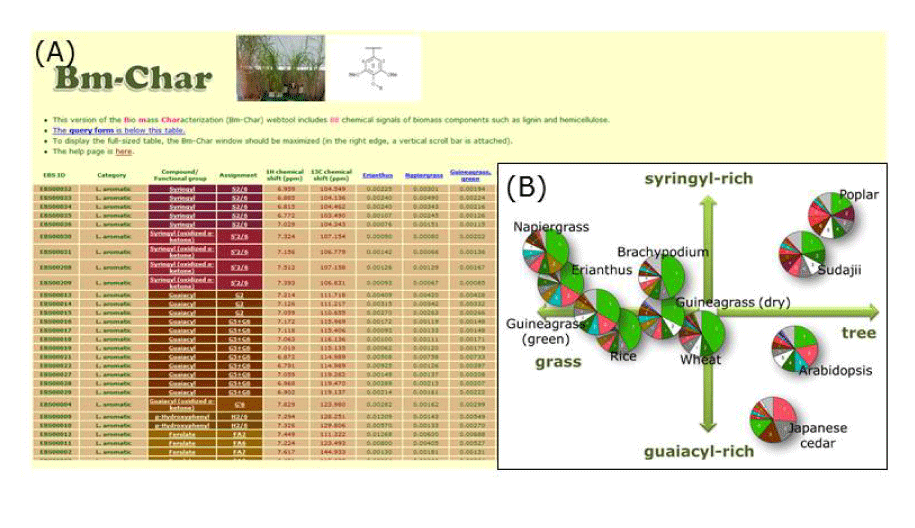
| Figure 4: Bm-Char for characterizing the lignocellulosic component, the main biomass product. (A) The portal includes the Bm-Char table that represents relationships between 88 chemical group 1H-13C NMR signals of lignin and hemicellulose from plant macromolecular fractions, a picture of the plant sample, and structures of lignocellulose components. (B) Pie charts showing the retrieval results for 11 queried plant samples. Different plant species show compositional differences in lignin and hemicellulose. The charts are arranged according to the 2 axes of the main principal components based on information of the lignin aromatic region of the 2-D NMR spectra; i.e., tree-to-grass (horizontal) and syringyl-to-guaiacyl (vertical). The 3 tree species are located on the tree side of the quadrant, while all grasses are located on the grass side. |