 |
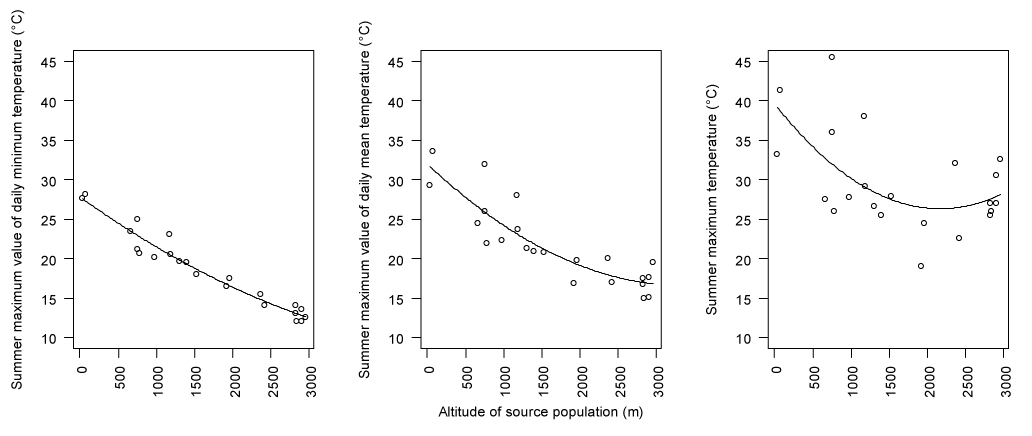
| Figure 2: Scatterplots for the summer maximum of three soil temperature (5-cm depth) properties at the location of the source population as a function of altitude. Summer maximum values of daily (left) minimum temperature, (middle) mean temperature, and (right) maximum temperature. Regression lines were derived from the best-fit non-linear models (Table 3). |