 |
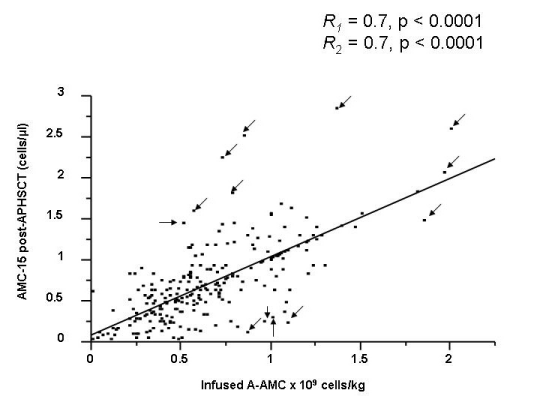
| Figure 6: Scatter plot comparing absolute monocyte count at day 15 (AMC-15) post-autologous peripheral hematopoietic stem cell transplantation (APHSCT) and infused autograft absolute monocyte count (A-AMC). A positive correlation was identified between A-AMC and AMC-15. Arrows indicate those patients that according to the Mahalanobis distances are outliers. R1 and R2 correspond to the Pearson’ r values before and after eliminating possible outliers. The regression line was estimated after the elimination of outliers. |