 |
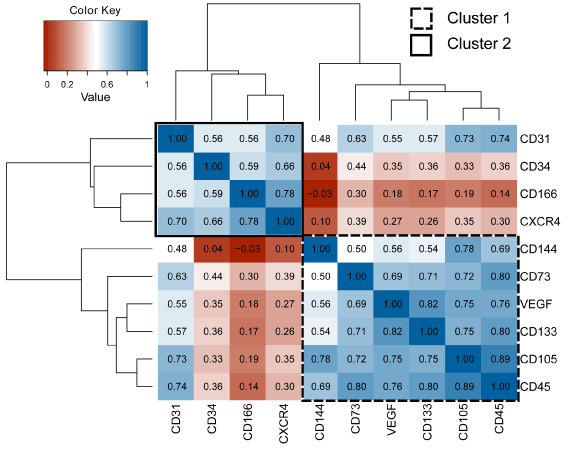
| Figure 2: The CD45neg MNCs clusters in two subpopulations according to the changing intensities of the specific surface markers during bone regeneration. The underlined and dotted squares illustrate the division of the surface markers in respectively cluster 1 and cluster 2 according to their internal correlations. The numbers in the squares are the correlation coefficients, which are also explained in the colour key. |