 |
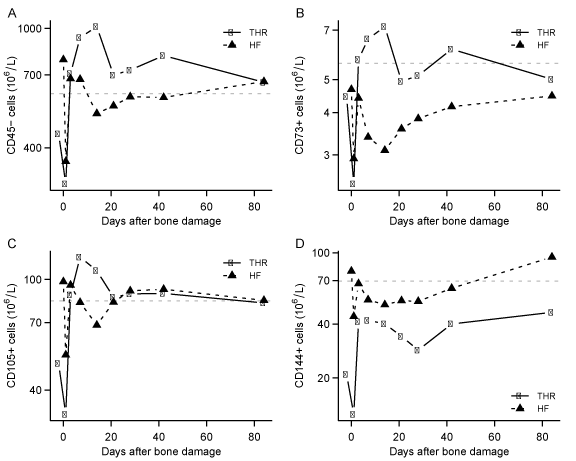
| Figure 3: Show changes during bone regeneration in CD45neg MNC (A), CD73pos, CD45neg MNC (B), CD105pos, CD45neg MNC (C), CD144pos CD45neg MNC (D) (Cluster 1). The initial drop is underlined by p-values. The grey line shows the level of the specific surface marker in healthy subjects. |