 |
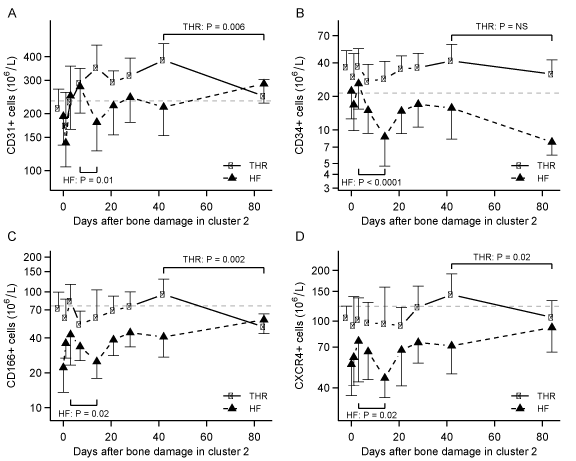
| Figure 4: Show changes during bone regeneration in CD31pos, CD45neg MNC (A), CD34 pos, CD45neg MNC (B), CD166pos, CD45neg MNC (C) and CXCR4pos, CD45neg MNC (D) (Cluster 2). The decline at day 14 of all the surface markers on cells in cluster 2, which are only seen in patients with hip fractures, is documented by p-values in the figure. The grey line shows the level of the specific surface marker in healthy subjects. |