 |
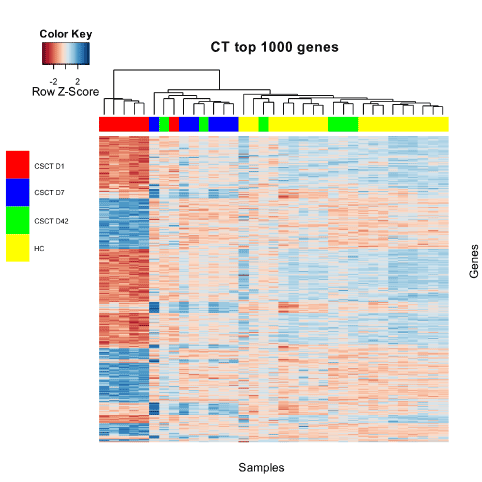
| Figure 5: The heat map shows the standardised values of the 1000 most time-varying genes. Red bars mean an up regulation of the gene and blue bars mean a down regulation of the gene. The genes are row-wise sorted by a cluster algorithm according to their similarity with other genes. Likewise are the samples column-wise sorted by a cluster algorithm according to their similarity with other samples. The coloured squares between the dendrogram and the heat map indicate the time point of the collection: Columns under red squares are taken 3-5 hours after fracture (D1), columns under blue squares are taken at day 7 after fracture, columns under green squares are taken at day 42 after fracture and columns under yellow squares are from healthy subjects. The genetic expression changes during bone regeneration from very aberrant at 3-5 hours after fracture, towards almost normal at day 42. |