 |
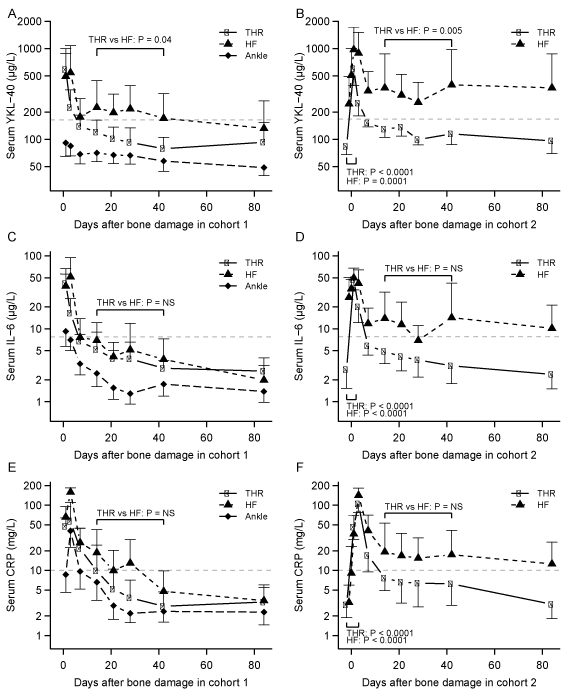
| Figure 6: Figure 6A, 6C and 6E shows changes of YKL-40, IL-6 and CRP in patients in cohort 1. Figure 6B, 6D and 6F shows changes of YKL-40, IL-6 and CRP in patients in cohort 2. Dotted grey lines mark upper boundaries of normal levels of the cytokines. The initial rise in all the cytokines within the first day in patients with hip fractures are documented by p-values for patients in cohort 2 at the bottom of the figure. The elevated levels of YKL-40 from day 14-42 in patients with hip fractures compared to patients with total hip replacements in cohort 1 and 2 are documented by p-values at the top of figures 6A and 6B. |