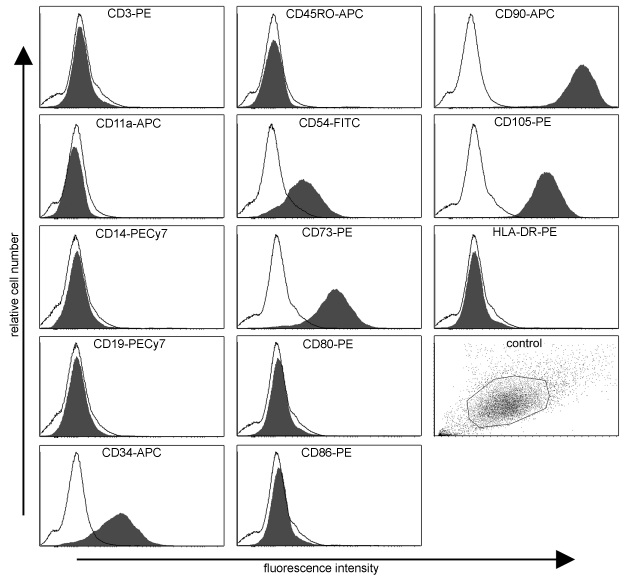
 The surface marker expression was characteristic for undifferentiated hASC as analyzed by flow cytometry. The graph shows the fluorescence intensity
(x-axis) and the relative cell number (y-axis). Unstained control cells are represented as empty histograms, whereas antibody stained cells are presented
as filled histograms. The unstained control sample dot plot is showing particle size and granularity (side scatter vs. forward scatter).