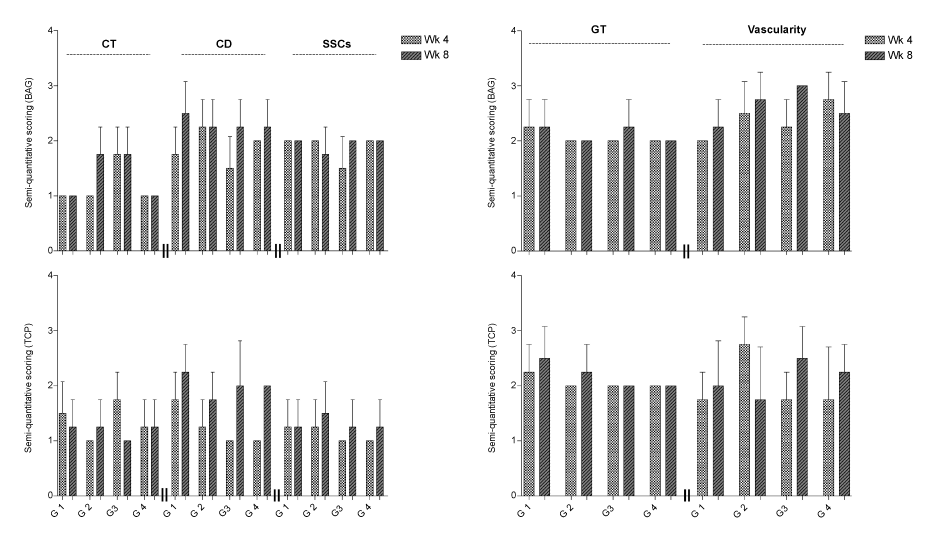
 The figure shows representative images for BAG and β-TCP at week 8. At weeks 4 and 8, no statistical differences were observed among treatment groups
and time points evaluated for capsule thickness (CT), cell densities (CD), spindle-shaped cells (SSCs), amount of periimplantar granulation tissue (GT) and
vascularization. G1 – G4 = groups 1-4.