 |
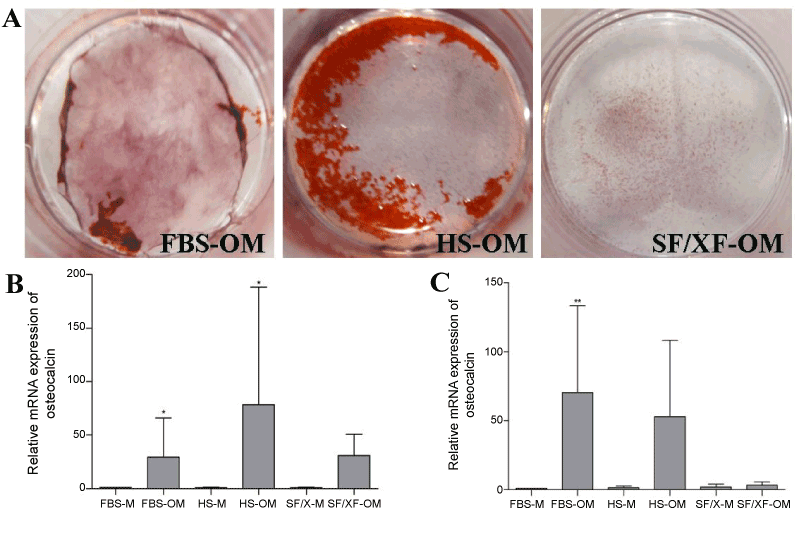
| Figure 6: The osteogenic differentiation analysis for DPSCs cultured in FBS-OM, HS-OM and SF/XF-OM. Alizarin red stained the calcified mineralized matrix (A) and qRT-PCR analysis of osteogenic differentiation related gene expression for OCN (B) and OPN (C). Data represents the mean ± SD and are normalized to housekeeping gene RPLP0. (n = 4, *p < 0.05, **p< 0.01 ***p< 0.001). (Online version in colour). |