|
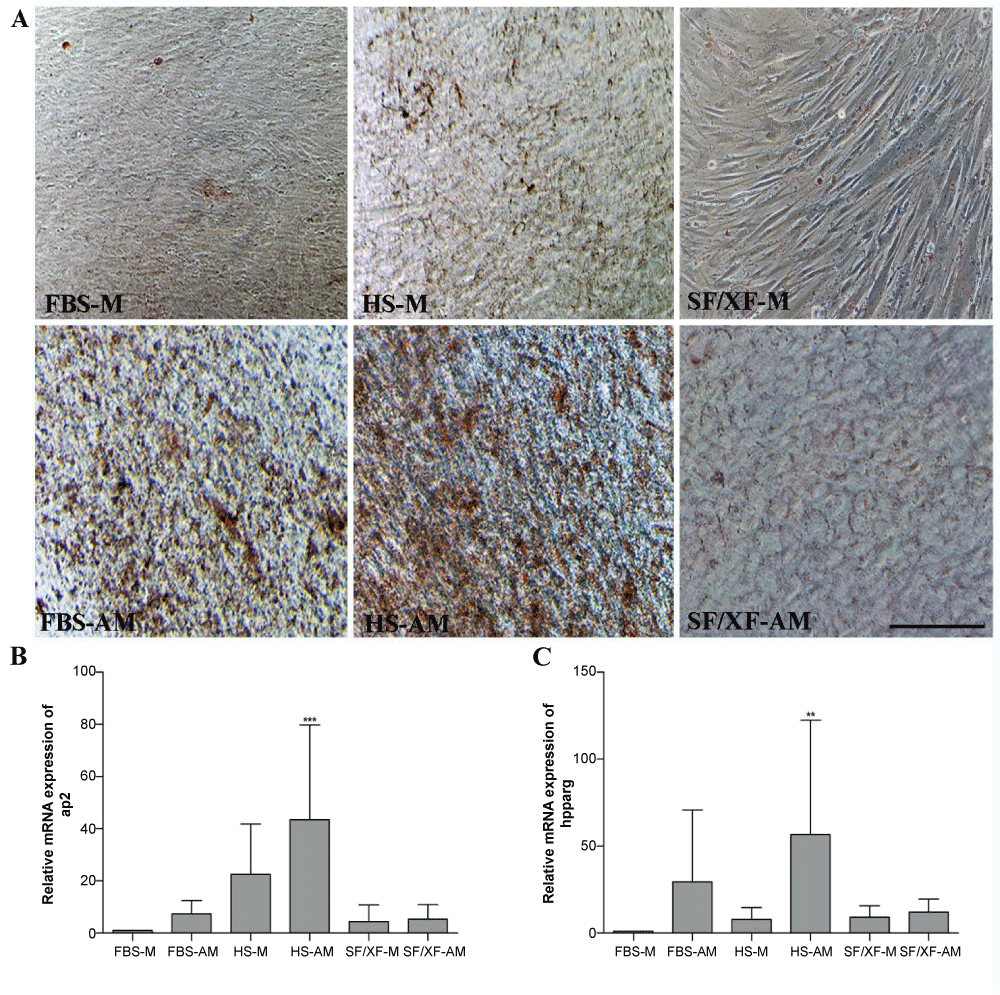
| Figure 8: Adipogenic differentiation for DPSCs cultured in FBS-AM, HSAM and SF/XF-AM in comparison to cells cultured in FBS, HS and SF/ XF media. Oil O red staining showing lipid accumulation in adipogenically induced cultures (A) (Scale bar = 100 μm) and qRT-PCR analysis of adipogenic differentiation related gene expression for hPPARG (B) and AP2 (C). Data represents the mean ± SD and are normalized to housekeeping gene RPLP0. (n = 4, *p < 0.05, **p< 0.01 ***p< 0.001). (Online version in colour). |