 |
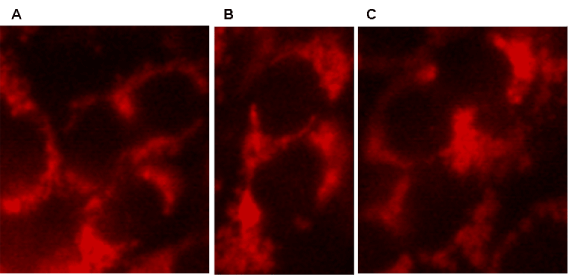
| Figure 1: Display of TRA-1-60 on the ECO cells. The ECO, ESC, and ECT cells were labeled with the fluorescent scFv targeting TRA-1-60. They were imaged with multiphoton fluorescence. The kinetics of labeling was determined upon the digital quantum intensity profiles presented in the figure 3. Intensity and pattern of labeling of the ECO cells (A) is identical to the ESC (B) and ECT (C) cells. Magnification: 1,000 x. |