 |
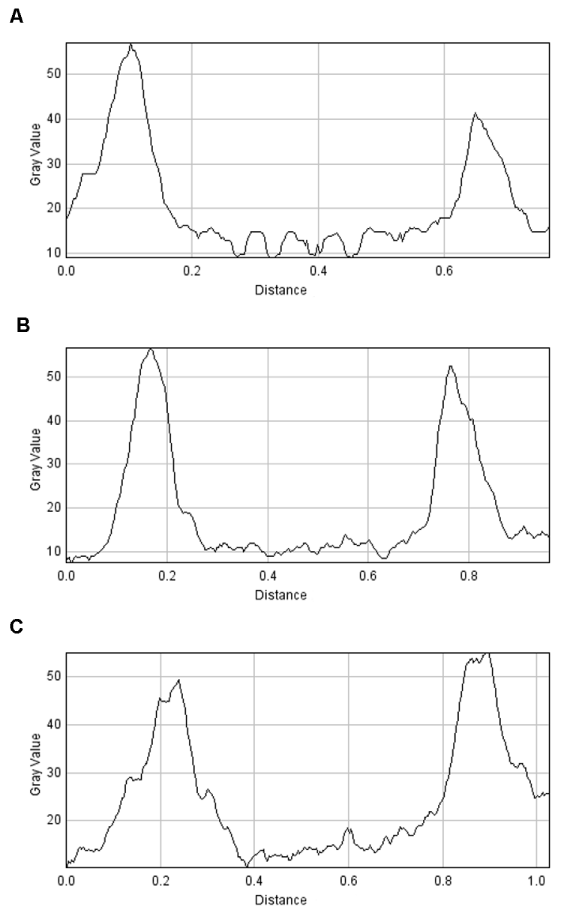
| Figure 2: Quantified kinetics of the TRA-1-60 display on the ECO cells. The images of the ECO, ESC, ECT cells acquired as described in the figure 2 were quantified by measuring pixel intensity values across the cells’ diameters to reveal the kinetics of the scFv display. They show identical kinetics of labeled the ECO (A), ESC (B), and ECT (C) cells. They also demonstrate the identical, high ratio between the nucleoplasm and cytoplasm is all these cells. |