 |
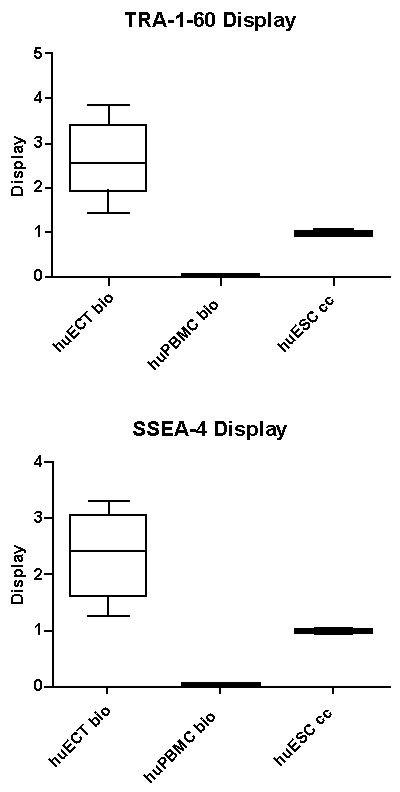
| Figure 4: Display of TRA-1-60 and SSEA-4 in the enriched samples of the cells acquired from the patients with embryonal carcinomas of the testes (ECT), relative to the cultured human embryonic stem cell lines (huESC cc) and the peripheral blood (huPBMC bio), was quantified by NMRS. Since the Fvs were chelating superparamagnetic metals, then they were causing shortening relaxation times, thus increased relaxivities, of the labeled samples. Each sample was run in triplicates. The data presented in the figure are representative for all the samples and controls. The relative display was quantified by calculating the ratios (y-axis), between the relaxivity of the patients’ samples in relation to the averaged value for the sample of the labeled huESC cells, which was considered as 1. The differences between the recordings are presented as the standard deviation. Labels as in the figure 2: the primary tumors of the patients diagnosed with the embryonal carcinoma of the testes (huECT bio) (the patients encoded 001-009), the peripheral blood (huPBMC bio), the cultured human embryonic stem cell lines (H1, H13, H14) (huESC cc). The statistical significance was accepted at p < 0.001. |