 |
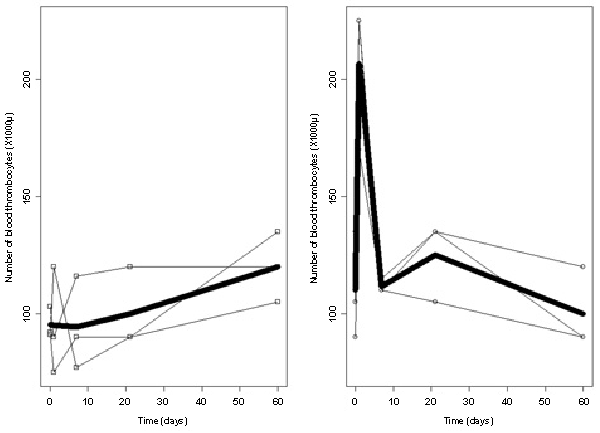
| Figure 3: In contrast to the rather constant thrombocyte levels in the control group (left figure), a two-fold increase could be noticed at 1 day after the intravenous allogenic mesenchymal stem cell (MSC) injection (T1) (right figure). The narrow lines represent the different individuals, whereas the thick lines represent the average values. |