|
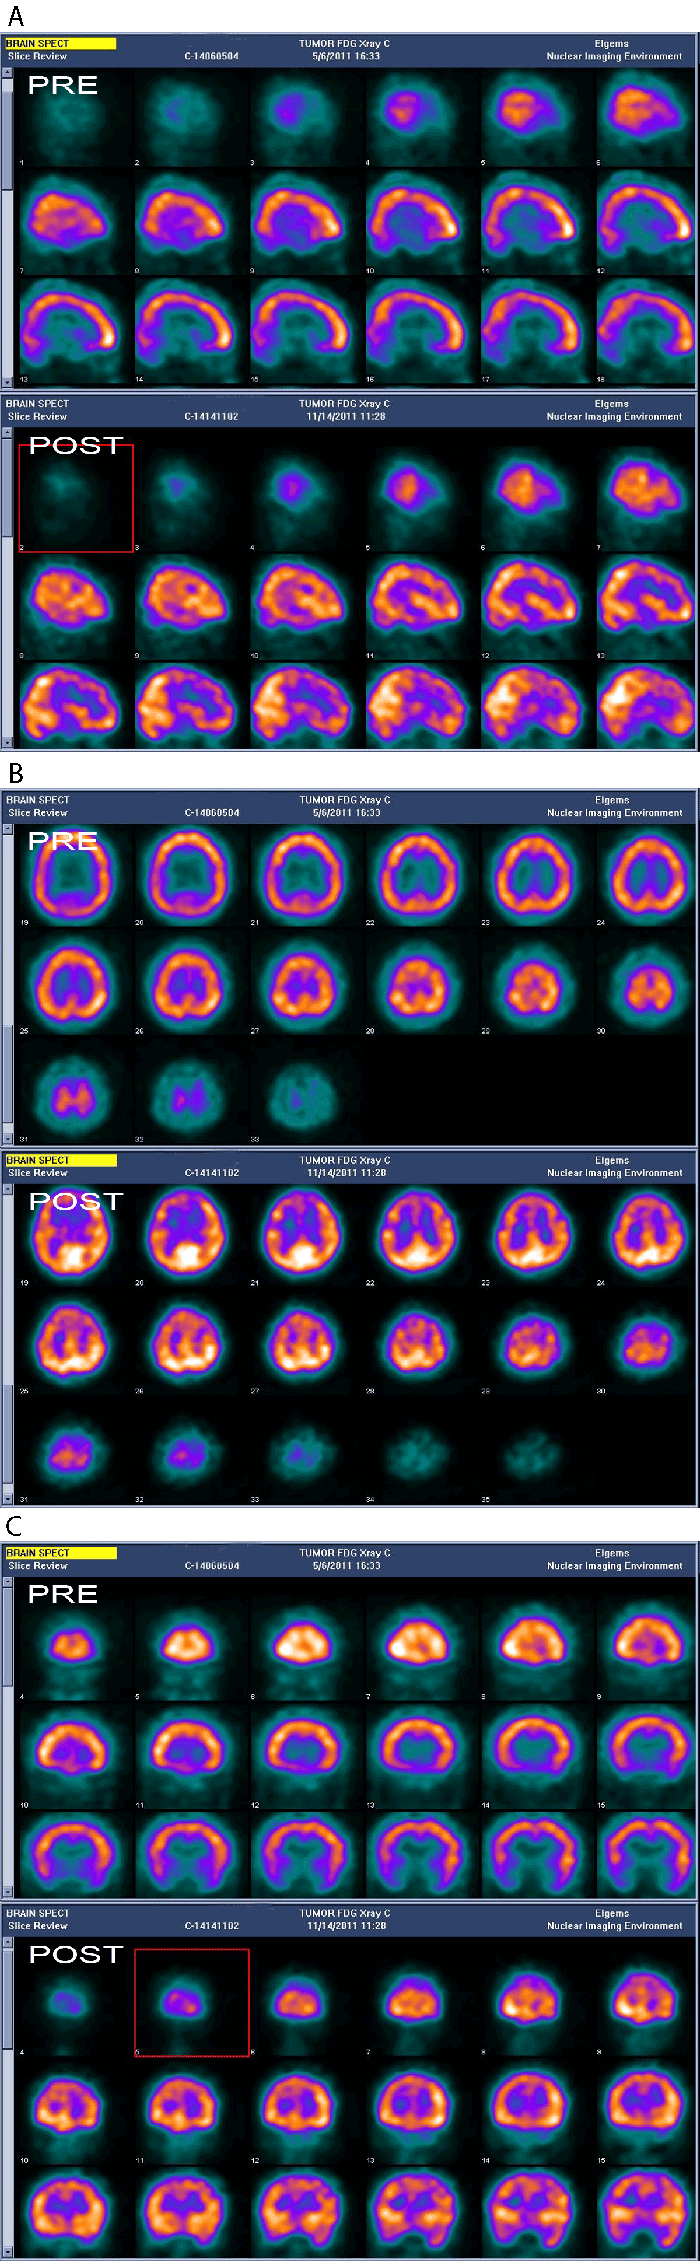
| Figure 1: A, B, C: The Pre and the Post cell therapy PET CT scans. Comparative study of pre and post cell therapy PET CT scan shows increased FDG uptake in bilateral temporal lobes and bilateral calcarine cortices with mild increased uptake in left medial pre-frontal cortex as visualized below in the post scans. |