|
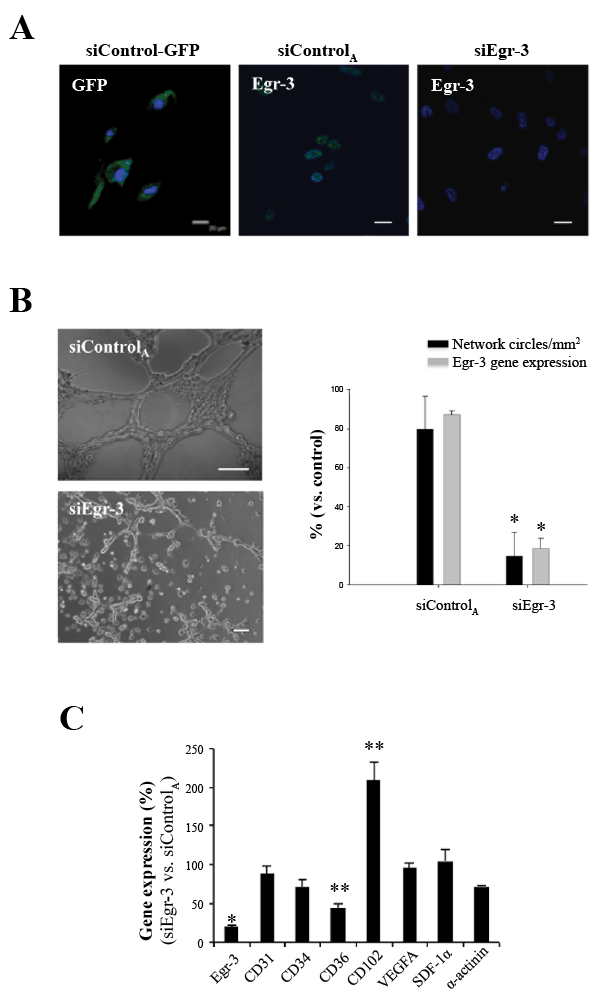
| Figure 5: Inhibition of UCBMSC angiogenic capacity by specific suppression of Egr-3. (A) Representative images showing internalization of control sequence (siControl-GFP conjugate) (left), and specific detection of Egr-3 in siControlA- (middle) and siEgr3-transduced (right) cells. Scale bars: 20 μm (B) Representative images of the cell network developed by UCBMSCs transduced with siControlA and siEgr-3 after 5 h in Matrigel. Histogram indicates the number of network circles and the transcriptional levels of Egr-3 in siControlA- and siEgr3-transduced cells. A minimum of 10 microscopic fields per condition and experiment (n=3) were analyzed. Scale bars: 100 μm. Values are expressed as mean ± SD and *P<0.001. (C) Transcriptional profile exhibited by siEgr-3-transduced UCBMSCs showing the relative changes (compared with siControlA-transduced cells) in specific (CD31, CD34, CD36, CD102 and VEGFA) and non-specific (SDF-1α and sarcomeric α-actinin) endothelial cell genes. N=3 with similar results. Values are expressed as mean ± SD. *P<0.001 and **P<0.05.: PMA induces phosphorylation of ERK1/2 in UCBMSCs. Western blot panels show that ERK1 (44 kDa) and ERK2 (42 kDa) were phosphorylated following exposure to PMA. In contrast, addition of U0126 suppressed PMA-mediated ERK1/2 phosphorylation. Histogram depicts protein levels as arbitrary units (A.U.), which were determined by densitometry in three independent experiments. A 3.6-fold activation of ERK1/2 was detected in PMA-treated relative to control cells. N=3 for each experimental condition with similar results. Values are expressed as mean ± SD. *P=0.021 and **P=0.014. |