|
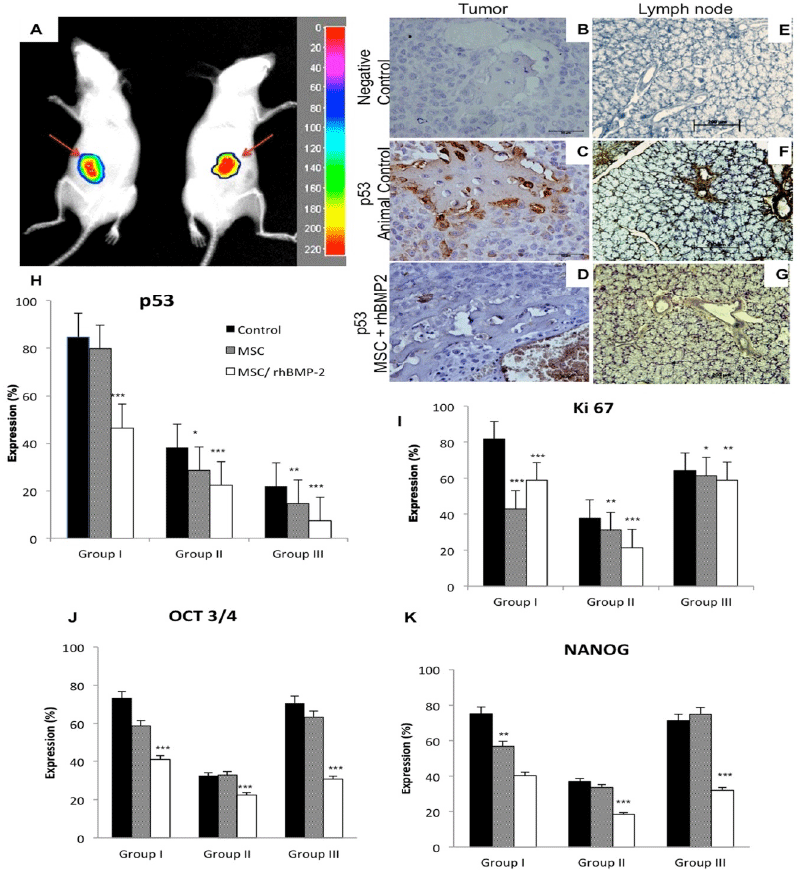
| Figure 2: Expression of proliferation and pluripotency markers. (A): Identification by bioluminescence of the primary sites of OST cells (arrows) in the lombar region in animals from group III. OST cells were transduced with LeGO IC2 lentiviral vector. (B-G): Immunohistochemestry for p53 on tumor and lymph nodes tissues from animals of the group III. In B and E: negative control. (C and F): animal control from group III. (D and G): tumor and lymph nodes tissue treated with MSC/rhBMP-2 showed a decreased expression of p53. (H-K): markers expression by flow cytometry treated with MSC, MSC/rhBMP-2. In (H): the most expressive reduction of the p53 expression occurred with the association of MSC/rhBMP-2. (I) expression of Ki67 reduced in the groups II and III. (J and K): the decreased expression of pluripotency markers (Oct ¾ and Nanog) was similar. Statistical differences were obtained by analysis of variance (*** p < 0.001, ** p < 0.01, and * p< 0.05). |