 |
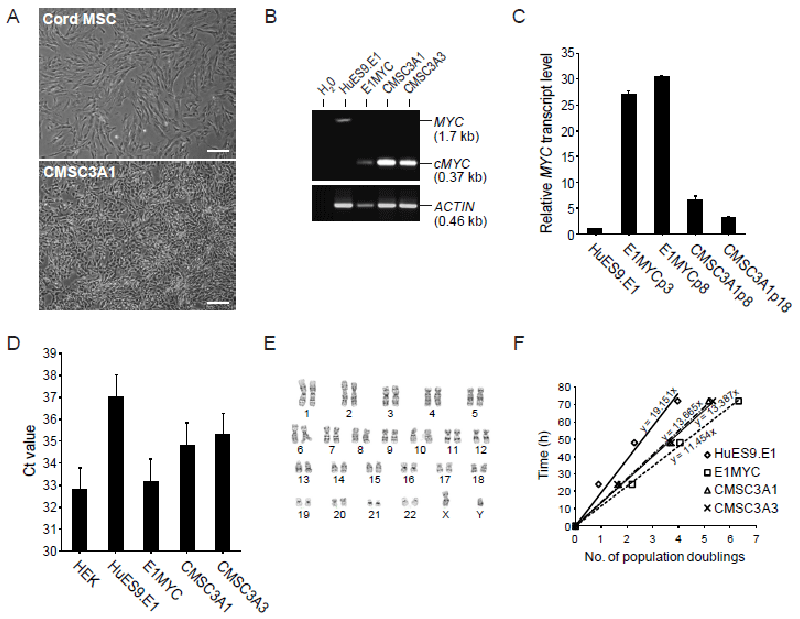
| Figure 1: Immortalization of cord MSCs. (A) Cell morphology of parental cord MSC and MYC-transfected cord MSCs as observed under phase contrast microscopy, scale bar 100 μm. (B) PCR analysis of cellular DNA from HuES9.E1 MSCs, MYC-transfected HuES9.E1 MSCs (E1-MYC), and MYC-transfected cord MSCs clones CMSC3A1 and CMSC3A3. DNA was amplified using primers specific for exon 2 and exon 3, respectively. The expected PCR fragment size for the endogenous MYC gene was 1.7 kb and for the transfected MYC cDNA was 0.37 kb as represented by the amplified fragment from the MYC lentivirus. (C) Relative MYC transcript level. MYC transcript levels in HuES9.E1 (MSCs derived from hESC), E1MYC16.3 (MYC-transformed HuES9.E1 MSC line) at p8 and p18, and CMSC3A1 MYC-transformed cord MSC line at p8 and p18 were determined by quantitative RT-PCR. The internal reference for each sample was GAPDH transcript. The MYC transcript level in each sample was normalized to that in HuES9.E1. (D) Relative telomerase activity. Telomerase activity in each cell type was assayed using 1 μg of cell lysate protein to first extend a TS primer and any extendedproduct was then quantitated by real time PCR. The Ct value reflected the amount of telomerase product and therefore the telomerase activity in the lysate. Note: Ct value is inversely proportional to the template concentration in the PCR reaction. (E) Karyotype analysis of CMSC3A1 by G-banding. (F) Rate of cell cycling. Cells were labelled with CFDA and their fluorescence was monitored over time by flow cytometry. The loss of cellular fluorescence at each time point was used to calculate the number of cell division that the cells have undergone as described in Materials and Methods. |