 |
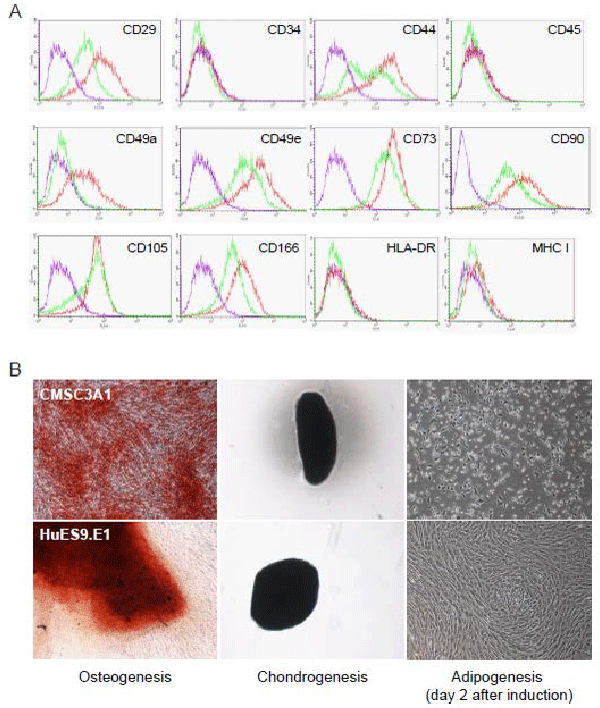
| Figure 2: Surface antigen profiling and differentiation potential. (A) CMSC3A1 (green) and HuES9.E1 (red) MSCswere stained with a specific antibody conjugated to a fluorescent dye and analyzed by flow cytometry. Nonspecific fluorescence (purple) was assessed by incubating the cells with isotype-matched mouse monoclonal antibodies. (B) HuES9.E1 and CMSC3A1 MSCs were induced to undergo (left panel) osteogenesis and then stained with von Kossa stain; (middle panel) chondrogenesis and then stained with Alcian blue; (right panel) adipogenesis where CMSC3A1 and HuES9.E1 MSCs were exposed to adipogenesis induction medium for two days. |