 |
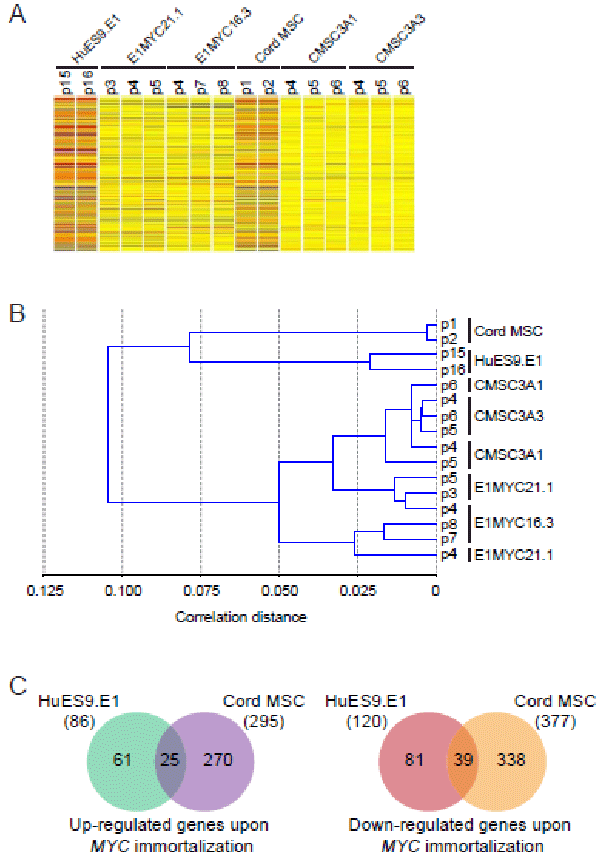
| Figure 3: Gene expression profile of MSCs and their MYC-transformed progenies. (A) A heat map of the gene expression profiles of hESC- and cord-derived MSCs and their MYC-transformed progenies at different passage numbers. (B) Hierarchical clustering of expressed genes by the various MSC lines. (C) Distribution of up674 regulated (left panel) and down-regulated (right panel) genes upon MYC immortalization of HuES9.E1 and cord MSCs, represented by Venn diagrams. Fold change > 2.0. |