 |
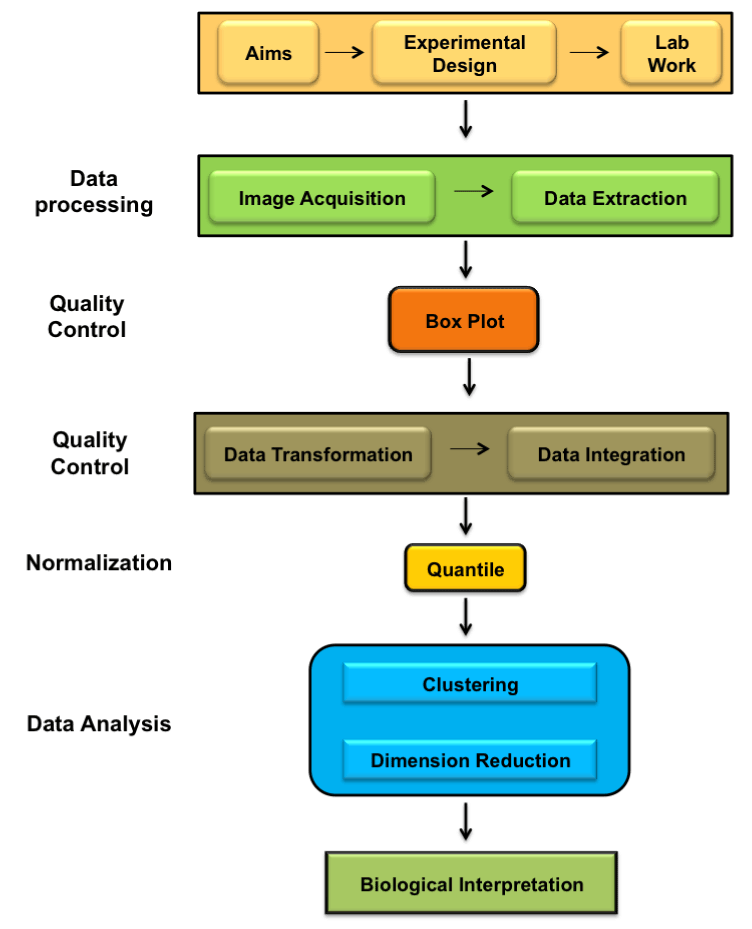
| Figure 4: Schematic representation showing steps undertaken for gene expression profiling. Experiment starts with biological question(s) followed by its design and hybridization. Hybridized chip is introduced into the scanner and the intensities of every sample are acquired as image files and later the data is extracted from these image files. The quality of each sample is verified by Box Plot analysis. After verification, the data is transformed to log2 scale and integrated using virtualArray package. The integrated “Expression Set” is normalized between arrays using quantile method. The normalized data are later subjected to hierarchical clustering and PCA to address the biological question(s). |