 |
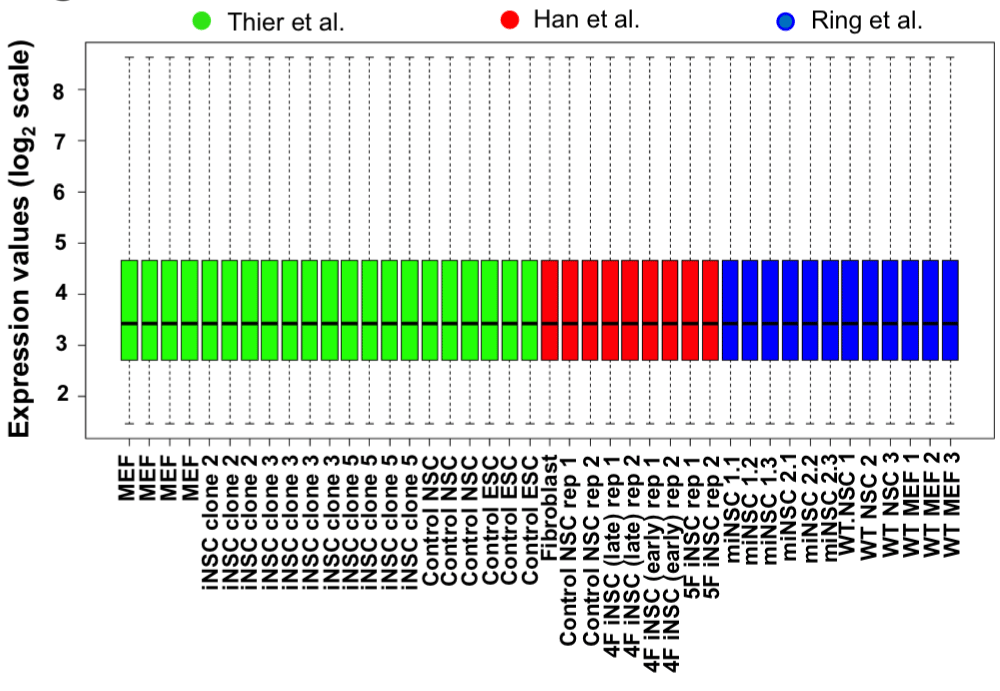
| Figure 5: Box Plot analysis of the three datasets after transformation, integration and normalization. The three heterogeneous datasets (Han et al., Ring et al., and Thier et al. [10-12]) generated from different platforms were log2 transformed, integrated and quantile normalized using standard R functions and Bioconductor packages. The X-axis shows the list of samples used to transform for each datasets and the Y-axis shows the expression values in log2 scale. |