 |
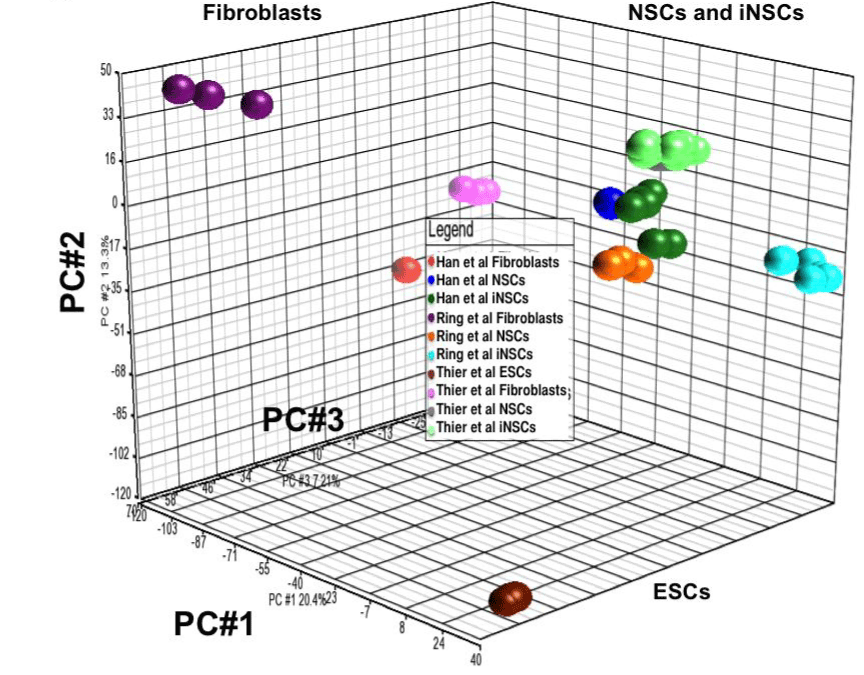
| Figure 7: Principal Component Analysis (PCA) of combined virtual datasets. The normalized “Expression Set” generated through virtualArray from R/Bioconductor package and was loaded to Partek Genomics Suite. The high dimensionality of the three datasets was simplified and their patterns were identified using PCA module with default parameters, correlation dispersion matrix and normalized eigen vector scaling. The end results were visualized in 3D scatter plot. The values on the axes are the PC values and the percentage indicates the variance proportion captured by each PC. |