|
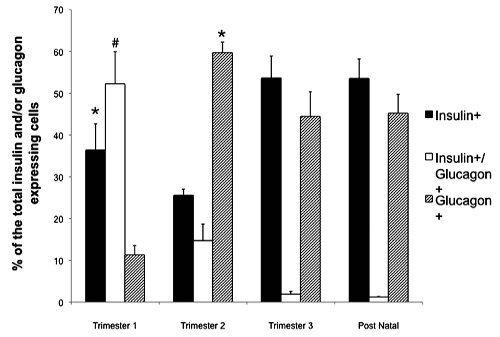
| Figure 2:Quantification of insulin and glucagon expressing cells in the fetal and post natal pancreas. Percentage of total insulin expressing (black), co-expressing insulin and glucagon (white), and total glucagon expressing cells (cross hatch) relative to the total population of cells producing insulin and/or glucagon. Data is expressed mean ± SEM, *p<0.025 within the same trimester and #p<0.025 for co-expression vs. other time points. |