 |
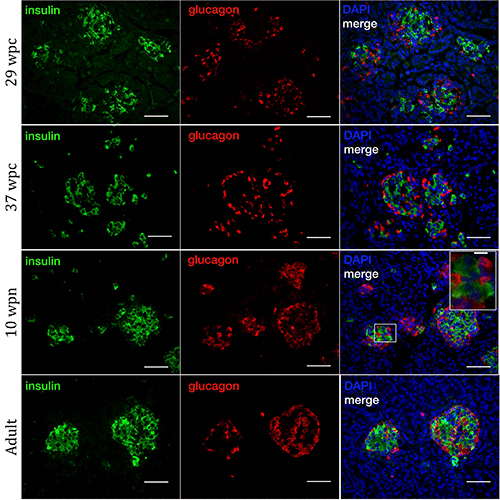
| Figure 3: Insulin (green) and glucagon (red) expression during the third trimester of human fetal development (24 wpc-birth(38 wpc)) as demonstrated by samples 29 and 37 wpc, as well as 10 wpn, and adult. In the third trimester, the proportion of insulin and glucagon expressing cells are equivalent. Similar to the post natal samples, insulin and glucagon expressing cells are intermixed within the islets. In the third trimester and post natal samples, islet size is more homogeneous across the tissue section. No co-expression of insulin and glucagon was observed. DAPI nuclear counterstain (blue). Area denoted by a box is shown at higher magnification (inset). Scale bars are 50 and 10 μM respectively. |