|
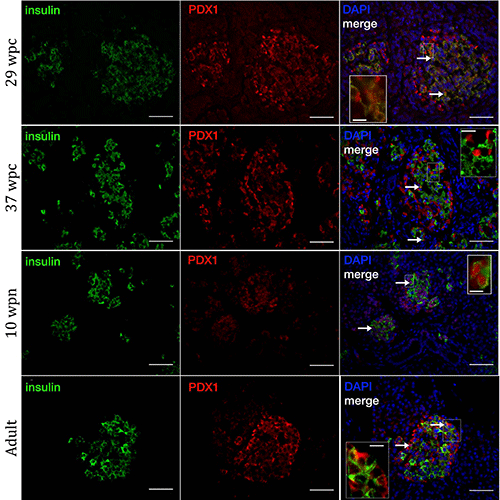
| Figure 5: Insulin (green) and PDX1 (red) expression during the third trimester of human fetal development (24wpc-birth (38wpc)) as demonstrated by samples 29 and 37 wpc, as well as 10 wpn, and adult. Arrows demonstrate examples of coexpressing insulin and PDX1 cells. In the third trimester, PDX1 expression is minimally detected in duct-like structures, and expression is also proportionatally less compared to the second trimester in the islet structures. The third trimester expression pattern is similar to the post natal and adult, where less PDX1 is co-expressed in insulin cells, and a few PDX1 alone cells are located at the periphery of the insulin cells. The first insulin alone expressing cell is observed at 37 wpc. DAPI nuclear counterstain (blue). Areas denoted by a box are shown at higher magification (inset) without DAPI. Scale bars are 50 and 10 μM. |