|
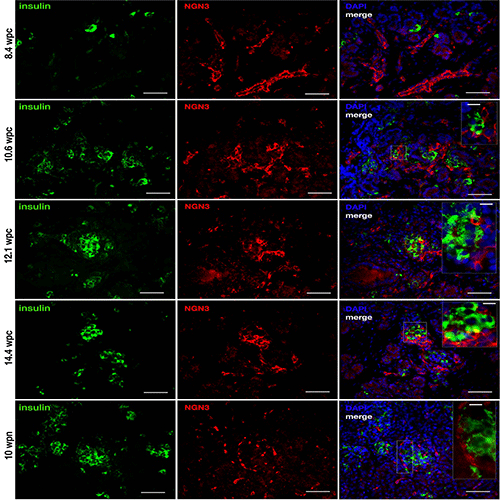
| Figure 9: Insulin (green) and neurogenin3 (NGN3, red) expression during the first trimester (8.4, 10.6, 12.1, 14.4) and post natal (10 wpn). At 8.4 wpc NGN3 cells are filamentous, elongated and are scattered throughout the section and arranged in branch-like formations. The NGN3 positive cells are not associated with the scattered insulin positive cells. At 10.6 wpc, NGN3 cells surround the first islet-like cell clusters in a wave-like pattern and the number of NGN3 positive cells appears to peak at this time point. At 12.1 and 14.4 wpc, while the NGN3 cell number decreases these cells are more closely associated with the forming islets and are found around and within the forming islet. Post natal (10 wpn), a few NGN3 cells are evident near and in the islet as well as scattered throughout the pancreas section. There is no evidence of insulin and NGN3 co-expression at any of these time points. Areas denoted by a box are shown at higher magnification (inset). Scale bars are 50 and 10 μM respectively. |