|
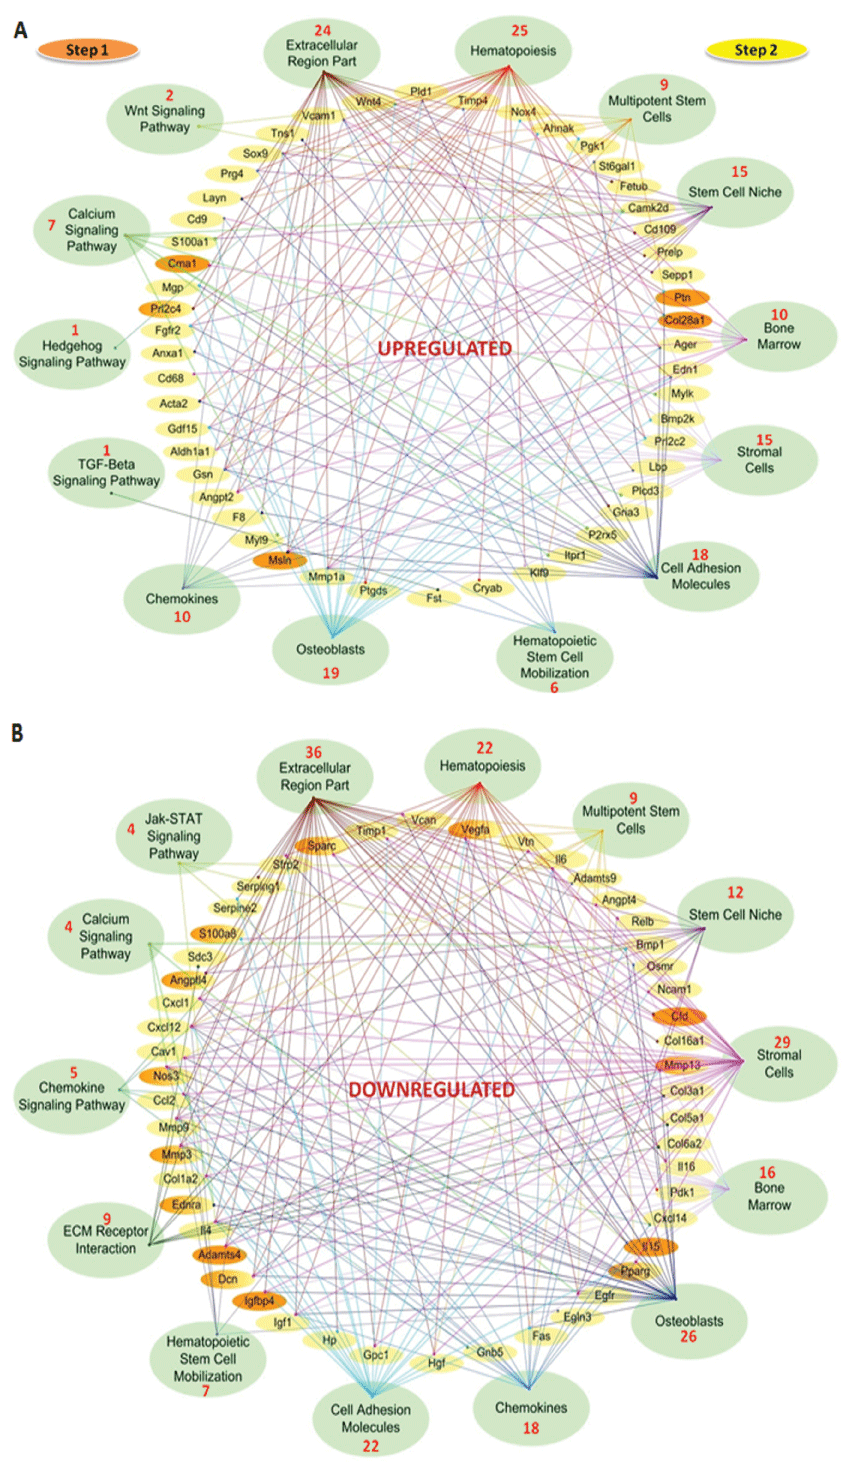
| Figure 5: Functional analysis of differentially expressed genes by EGAN software. (A) Up and (B) down regulated genes in step 1 and 2 and their involvement in hematopoiesis related networks respectively. These figures show fifty most represented genes imported from MetaCore pathway, each from up and down regulated groups. EGAN software relates them to their locations, pathways and networks indicating their involvement with hematopoiesis, osteogenesis, stem cell niche and other hematopoiesis related networks. Genes shown in orange boxes belong to step 1 where as those in yellow boxes are from step 2. Genes that were differentially expressed in both step 1 and 2 are shown in yellow-orange gradient boxes. Red numbers in the green boxes indicate the number of genes associated with that term. The resulting network from EGAN software was redrawn manually for clarity. |