 |
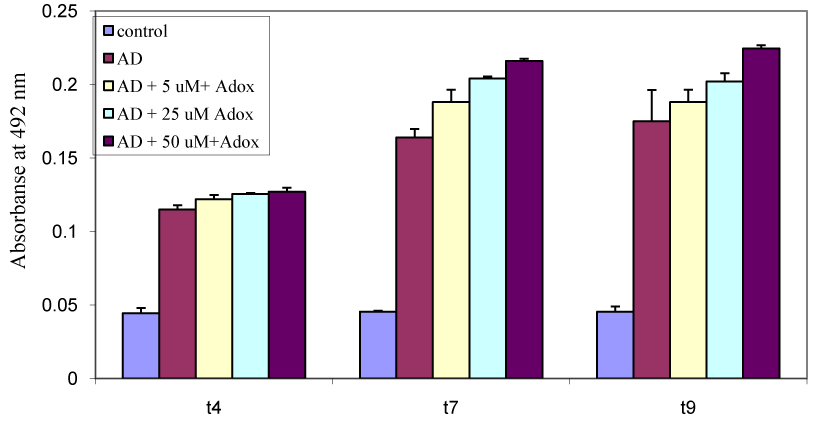
| Figure 6: Triglyceride of hMSC cells treated with Adox on day 4, day7 and day9 respectively. All measurements were done as duplicate and averaged, according to the protocol described in Material and methods. All cells in the control were only exposed to control medium, the other cells were cultured in Ad medium containing different concentrations of Adox. Results are expressed as means ± SD (n=3). Differences between means were significantly different p < 0.01 Error bars indicate standard deviations. |