Pre: preoperative; Post: postoperative. *p<0.05
 Pre: preoperative; Post: postoperative. *p<0.05 |
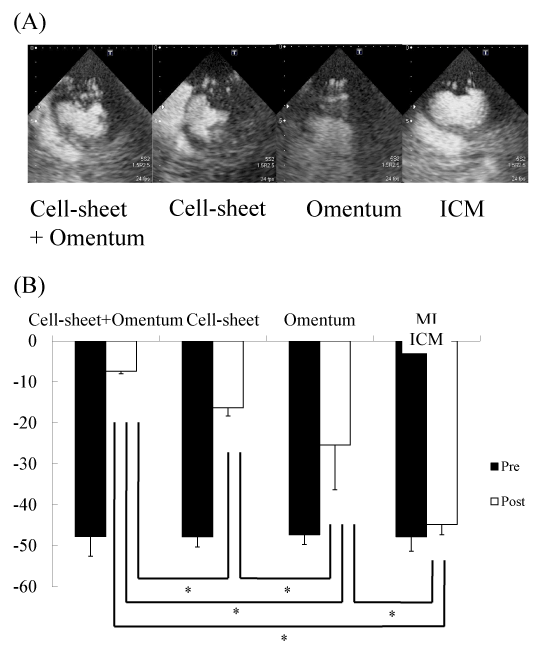
| Figure 2: Blood flow analysis by performing myocardial contrast echocardiography. (A) Representative left ventricular short-axis view of 1.5 harmonic imaging at 8 weeks after the treatment. (B) Quantification of blood flow. Postoperatively, blood flow was significantly increased in the Cell sheet+Omentum, Cell sheet, and Omentum groups. Postoperatively, blood flow was the highest after cell sheet with omentum implantation. |