|
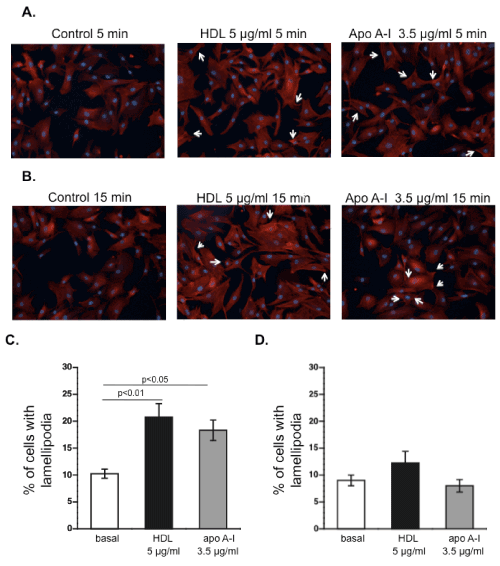
| Figure 4: HDL and apo A-I induce lamellipodia formation in mesenchymal stromal cells. Representative images of MSC stimulated with HDL or apo A-I for (A) 5 or (B) 15 min. Arrows indicate lamellipodia. Red staining (Alexa Fluor 546) reveals the actin filaments and lamellipodia, whereas the blue staining (DAPI) indicates the cell nuclei. Bar graphs representing the mean ± SEM of the % of cells with lamellipodia (C) 5 min or D. 15 min post HDL or apo A-I supplementation. |