|
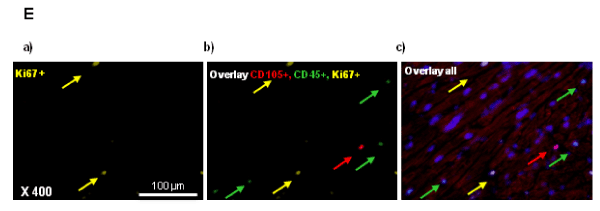
| Figure 3: MSC migrate into the cardiac tissue of patients with CMi. (A) Representative image of immunofluorescence of MSC in EMB. Serial sections were stained with (a) α-sarcomeric actin (red) and nuclear counterstained (DAPI, blue), (b) anti-CD105, and anti-CD90 (red) for MSC, and (c) anti-CD45 (green) as a lymphocytes marker. (B) Quantitative analysis of CD45−CD34−CD105+CD90+ -MSC in EMB of patients without (n=6) and with (n=23) cardiac inflammation, as defined by the number of LFA-positive cells (box plots are given as median and IQR; whiskers represent 95% CI). (C) Quantitative analysis of CD45−CD34−CD105+CD90+ -MSC in EMB after dichiotomisation with respect to SDF-1α mRNA expression in their EMB (cut-off: median, box plots are given for median and IQR; whiskers represent 95% CI). (D) Correlation between the transcardiac gradient of circulating MSC and MSC in EMB. (E) Representative image of immunofluorescence of MSC and proliferation in EMB. The same serial sections as indicated above (3A) were stained with (a) anti-Ki67 (yellow) for proliferation, (b) overlay of CD105 (red), anti-CD45 (green) and Ki67 (yellow) (c) overlay of α-sarcomeric actin (red), nuclei (DAPI, blue), CD105 (red), anti-CD45 (green), and Ki67 (yellow). |